How to List Running Processes in Linux: A Beginner’s Guide
VPS Jun 03, 2022 Domantas G. 4min Read
Need to view all running processes on your Linux server and discover which consumes your resources the most? Look no further, because, in this article, we’ll explain how to list processes by using several common Linux commands.
Download Complete Linux Commands Cheat Sheet
Introduction to Linux Processes
A process is the execution of a program. They can be launched when opening an application or when issuing a command through the command-line terminal. However, an application can run multiple processes for different tasks. For instance, Google Chrome will start a different process each time a new tab is opened.
A process can be initiated as a foreground or background process. Each Linux process is assigned a unique PID (process identification number).
Occasionally, processes may consume a lot of resources and need to be killed. Alternatively, times when you may want to change the priority level of a process, so the system will allocate more resources to it. Regardless of the case, all these tasks require you to do the same thing: listing the running processes on Linux.
How to List Running Processes in Linux?
To list processes in Linux, use one of the three commands: ps, top or htop. Ps command provides static snapshot of all processes, while top and htop sorts by CPU usage.
Let’s dive further into each of them.
Utilizing the “ps” Command
The ps (process statuses) command produces a snapshot of all running processes. Therefore, unlike the Windows task manager, the results are static.

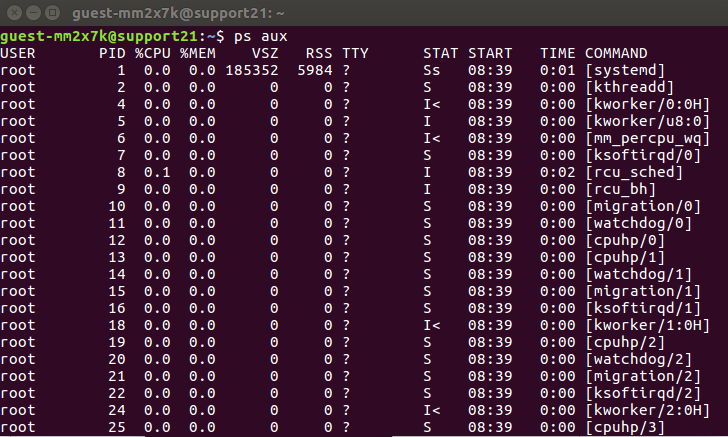
When this command is used without any additional argument or option, it will return a list of running processes along with four crucial columns: the PID, terminal name (TTY), running time (TIME), and the name of the command that launches the process (CMD). You can use ps aux to get more in-depth information about your running processes. Here’s a breakdown of each argument:
- a option outputs all running processes of all users in the system.
- u option provides additional information like memory and CPU usage percentage, the process state code, and the owner of the processes.
- x option lists all processes not executed from the terminal. A perfect example of this are daemons, which are system-related processes that run in the background when the system is booted up.
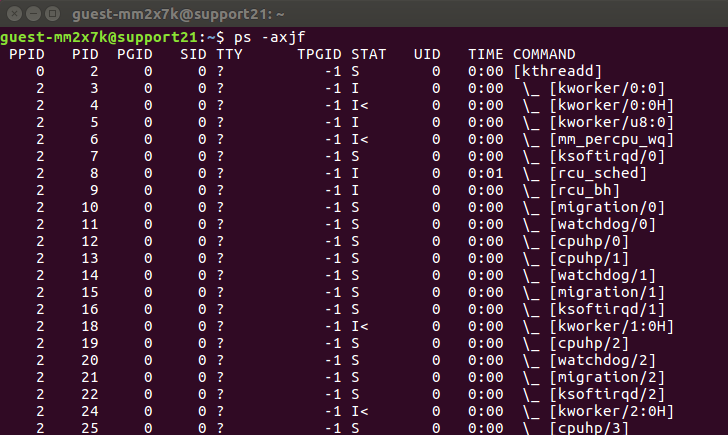
If you want to list Linux processes in a hierarchical view, use the ps -axjf command. In this format, the shell will put child processes under their parent processes. Aside from those two options, here are some other common examples of the ps command that list running processes in Linux:
- ps -u [username] lists all running processes of a certain user.
- ps -e or ps -A displays active Linux processes in the generic UNIX format.
- ps -T prints active processes that are executed from the terminal.
- Ps -C process_name will filter the list by the process name. In addition, this command also shows all child processes of the specified process.
Using the “top” Command
The top command is used to discover resource-hungry processes. This Linux command will sort the list by CPU usage, so the process which consumes the most resources will be placed at the top. It’s also useful to check if a specific process is running.
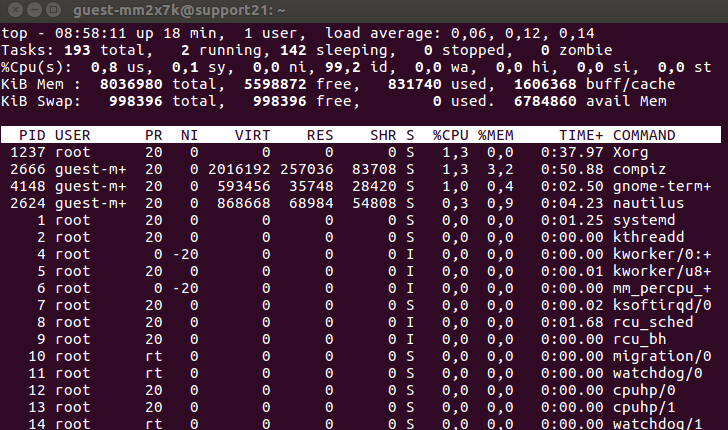
Unlike the ps command, the output of the top command is updated periodically. That means you’ll see real-time updates for CPU usage and running time. Once the shell returns the list, you can press the following keys to interact with it:
| Keys | Functions |
|---|---|
| k | Kills a process |
| M | Sorts the list by memory usage. |
| N | Sorts the list by PID. |
| r | Changes the priority of a process. |
| h | Displays the help window. |
| z | Displays running processes in colors. |
| d | Changes the refresh time interval. |
| c | Displays the absolute path of a process. |
| CTRL+C;or;q | Stops the top command. |
Keep in mind that the keys above are case sensitive, so be sure not to enable the caps lock.
Running “htop” Command
Both the htop and top command display the same information when listing your Linux processes, but the former offers user-friendly features that are great for everyday process management.
First thing first, the htop command allows you to scroll vertically and horizontally. As such, you can see the complete list of your Linux processes along with their full command lines.
What’s more, the command allows you to use a mouse to select items, kill processes without inserting their PIDs, change the priority of multiple processes easily, and so on.
Unfortunately, most Linux distributions don’t have this command right out of the box, so you need to install it manually.
If you use Ubuntu, you can install htop by running the following command:
sudo apt-get install htop
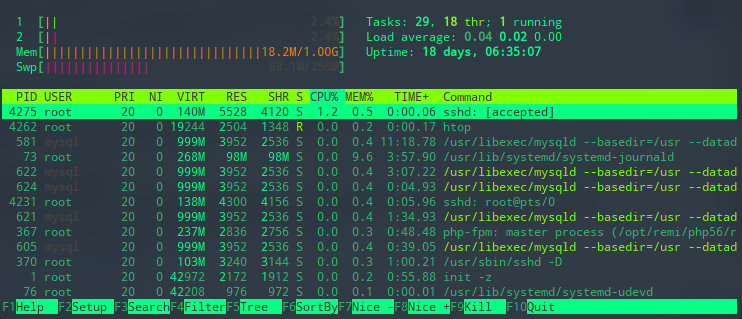
Once installed, type htop, and you’ll get a list of all your Linux processes. Just like the previous command, htop also has several keyboard shortcuts:
| Keys | Functions |
|---|---|
| F9 | To kill a process. |
| F8 | Increase the priority of a process. |
| F7 | Decrease the priority of a process. |
| F6 | Sort processes by any column. |
| F5 | Display processes in a tree view. |
| F4 | Filter the processes by name. |
| F3 | Search for a process. |
| F2 | Open htop setup. |
| F1 | Display the help menu. |
Using the “atop” Command
The atop command is a tool for monitoring system resources in Linux. It is an ASCII full-screen performance utility that logs and reports the activity of all server processes.
Once it is launched, atop will show the resource usage for the CPU, memory, swap, disks, and network in 10-second intervals. atop will stay active in the background for long-term server analysis (up to 28 days by default).
Some of the advantages include:
- Accumulates resource usage for all processes and users with the same name.
- Highlights critical resources in colors (red).
- Shows resource usage of all processes, including those that are completed or closed.
- Monitors threads within processes (except for unused ones).
- Uses netatop kernel mobile to monitor TCP, UDP, and network bandwidth.
You can install the atop command by running either of the following commands:
Ubuntu/Debian
sudo apt install atop
CentOS/RHEL/Fedora
sudo dnf install atop
Once installed, run the atop command to display all the process-level use of the system’s resources.
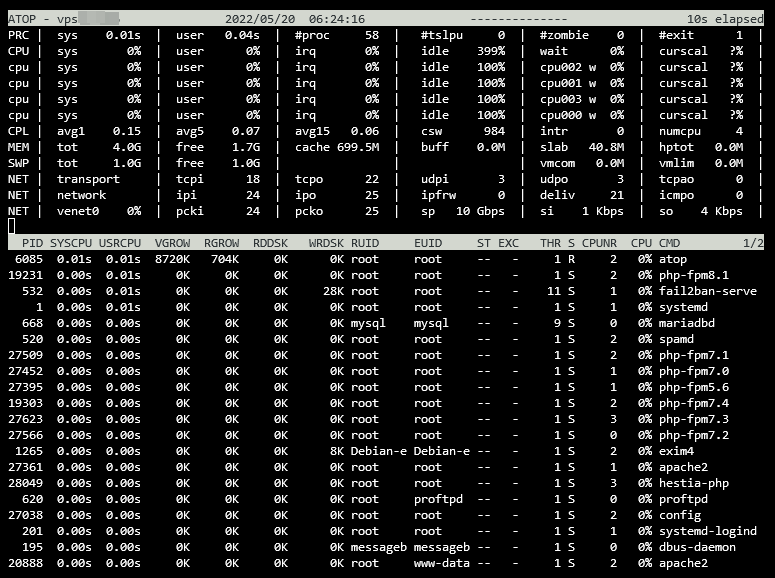
Here is the list of available arguments and their descriptions:
| Command | Description |
|---|---|
| man atop | Displays the atop command manual page. |
| atop -l | Displays the average-per-second total values. |
| atop -a | Displays the active processes during the last intervals. |
| atop -c | Displays the command line per process. |
| atop -m | Displays the memory-related information. |
| atop -d | Displays the disk-related information. |
| atop -n | Displays the network information. |
| atop -s | Displays the scheduling details. |
| atop -v | Displays the various info (for example PPID, user, or time). |
| atop -y | Displays the individual threads. |
Once atop is running, press the shortcut keys listed below to sort processes:
| Keys | Functions |
|---|---|
| a | Sorts in order of the most active resources. |
| c | Reverts to sorting by the CPU consumption (default). |
| d | Sorts in order of disk activity. |
| m | Sorts in order of memory usage. |
| n | Sorts in order of network activity. |
Conclusion
It is important to know how to list all running processes in your Linux operating system. The knowledge will be useful when you need to manage processes.
Which of the three commands do you prefer? Share your thoughts in the comment section below!
Master Other Linux Commands
How to Manage Sudo Users in Linux
How to Kill a Process in Linux
How to Test Connection With Ping Command
How to Use Dig Command for DNS Lookup
How to List Services in Linux
How to Change User Passwords in Linux